The Lanai · 4-bedroom, District 23
10days to secure buyer
Highest price in project
Two identical stacks were mispriced by S$60k. We listed against the higher stack ladder and let the comparable do the negotiating.

Data-Driven Property Consultant, Singapore
An engineer's approach to property: measure the market, isolate the factors that actually move price, then execute a launch that reaches the buyer wave while it is still there.
Move your cursor here to reveal the city
And which of these is you?
Pick the one that sounds like your situation. The answer below changes to match, and so does what I would put in front of you at a first meeting.
How I answer it
Growth does not stop with a bang. Your unit simply stops keeping pace with its own market, and every extra year of holding is paid for out of your next purchase.
Past trend
Your stack's caveat ladder, normalised for floor and size, against the project and its true comparables.
Current sentiment
Listing depth and days-on-market in your cluster — how much buyer attention exists right now.
Forward projection
Supply, lease position and catchment income modelled into a 3–5 year band for your unit.
What you get
A hold-or-sell verdict with the number behind it, and the window if the answer is sell.
The chart that matters

Who you are dealing with
Before property, I built 3–5 year plans for companies: prioritising what matters, planning the work and allocating the resources to execute it — from defect reduction programmes to variation control and supply chain throughput. The habit never left: define the objective, measure what is real, remove the noise, and control the outcome. Applied to a sale, that means your price is argued from evidence and your timeline is engineered — not left to the market's mood.
Median time to secure a buyer
Sellers achieved highest price in project
Past trend · Current sentiment · Forward price
Credentials
For sellers
Most valuations quote a single average PSF. I triangulate three independent signals and only trust the price where all three agree. Hover any panel to see the inputs behind it.

Signal 01
Every caveat in your project and its true comparables, normalised for floor, stack, size and age. I isolate the price ladder your unit actually sits on — not the headline PSF everyone quotes.
Inputs
Signal 02
Live listing depth, days-on-market, asking-to-transacted gap and viewing conversion in your postal cluster. This tells me how aggressive we can price before we lose the first-two-week buyer wave.
Inputs
Signal 03
Upcoming supply, en-bloc and land bids, infrastructure milestones and income growth in the catchment — modelled into a 3–5 year band so you know whether to sell now or hold with intent.
Inputs
Output
A defensible asking price + a launch window
Reviewed weekly against viewing-to-offer conversion

Same district, different outcomes
Two units in the same estate can differ by six figures. The difference is almost never luck — it is which numbers were read before the listing went live.
For owners deciding whether to move
A property does not fall off a cliff. It quietly stops keeping up. Set your remaining lease and see where the market's growth line and your asset's line separate.
Decay discount starts pricing in around 2041
Growth mode
Your unit still tracks or beats its cluster. Holding is compounding — the right move is usually to stay and monitor.
Depreciation mode
Your unit lags its cluster and the lease discount is being priced in by buyers. Every year of waiting costs twice: lost growth plus a widening discount.
Retirement planning · building capital through property
Buy on entry price and growth factor, not on décor. The first asset must be the one with the largest gap between price paid and fair value.
Hold through the growth window, monitor the lease-decay inflection, and exit before the decay discount is priced in by the market.
Recycle the gain into an asset with a longer runway or split into two smaller yield assets, depending on income and CPF position.
End state: a fully-paid yielding asset plus liquid reserve, sized against your target monthly retirement income.
Operational excellence, applied to property
Six Sigma taught me that averages lie and spread tells the truth. The same tools I used on production lines — distribution analysis and design of experiments — decide which unit to buy and what to ask for yours.
PSF distribution
Box = interquartile range (middle 50% of transactions) · line = median · whiskers = observed range. Value sits where a unit prints below the box in an otherwise healthy project.
Inter-project
Four projects in the same district can share a median and still be completely different bets. The one with the widest spread has the most mispriced units.
Intra-project
Inside Project A, unit type sets the price ladder — 2-bedders print the highest psf, 4-bedders the lowest. Selling against the wrong rung is the most common way owners leave money behind.
Design of experiments · factor effects
Every condo has a different performance fingerprint. One is lifted by a school within 1 km, another by the MRT walk, another by unit size. I rank the factors by measured effect size for the project in question, then hunt the outlier units inside it.
Affordability vs. growth
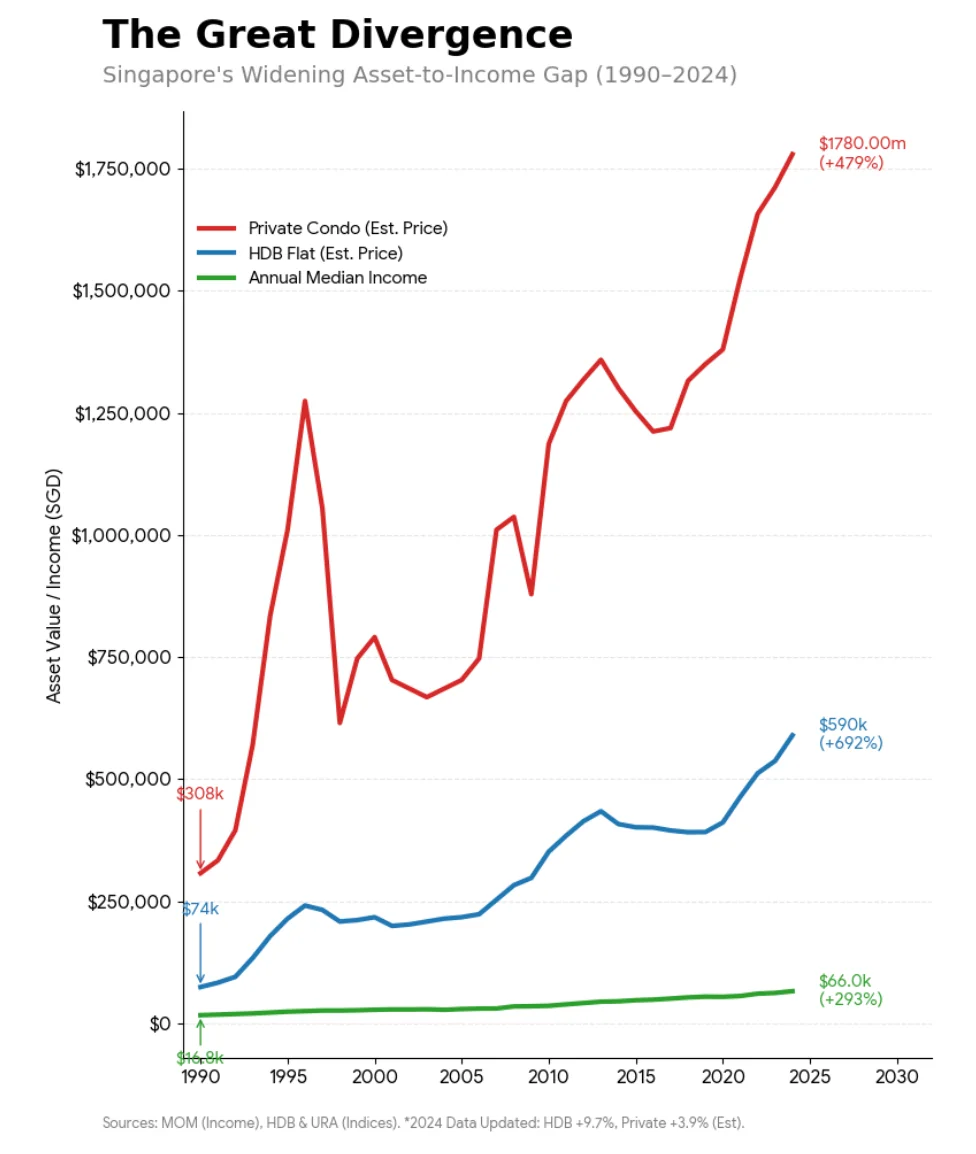
Since 1990, private condo prices are up about 479% and HDB about 692%, while median income grew about 293%. Assets have steadily outrun income — which is why entry price and timing matter more than waiting. Micro factors set your ceiling, macro factors set the clock.
How we locate your asset
When we run your target neighborhood through our Design of Experiments (DOE) Engine, we plot every available property onto this matrix based on its true infrastructure strength and entry pricing structure. Here is where most buyers get lost.
These projects look spectacular. They sit right next to the MRT, the mall, and a top school. Because they check every box, buyers let their emotions take over and pay a massive launch premium. Our model flags these instantly — the premium is so over-inflated that your future capital growth is completely capped on day one.
These properties have no major infrastructure moats, yet they are priced above the neighborhood average. Entering here places you on a dangerous downward price sensitivity curve.
Cheap, entry-level properties with zero unique location features. They will perform safely but will never beat the inflation baseline.
This is where we want to buy. These are developments where the infrastructure moat is exceptionally strong — MRT, school, or views are locked in — but due to market inefficiencies, local mispricings, or new harmonisation layout rules, the entry value is heavily optimized.
Where does your target condo sit on this map?
Evidence
The Lanai · 4-bedroom, District 23
Two identical stacks were mispriced by S$60k. We listed against the higher stack ladder and let the comparable do the negotiating.
Hillfort · Cluster landed, District 23
We plugged the gap and closed before other competing units could.
The Panorama · 2-bedroom, District 20
We sold the school over the school facing. Convenience and view governed the highest price in the project.
How I work · five steps, with a clock on each
Your objective, timeline and financial constraint — written down and quantified.
Caveat pull, stack normalisation, listing depth and sentiment scan for your project.
Price ladder, valuation band and the two or three factors that will actually move your buyer.
Positioning, photography, copy and launch timing built around the first two-week buyer wave.
Weekly viewing-to-offer conversion review, with a pre-agreed trigger to adjust rather than drift.
Current inventory
My listings
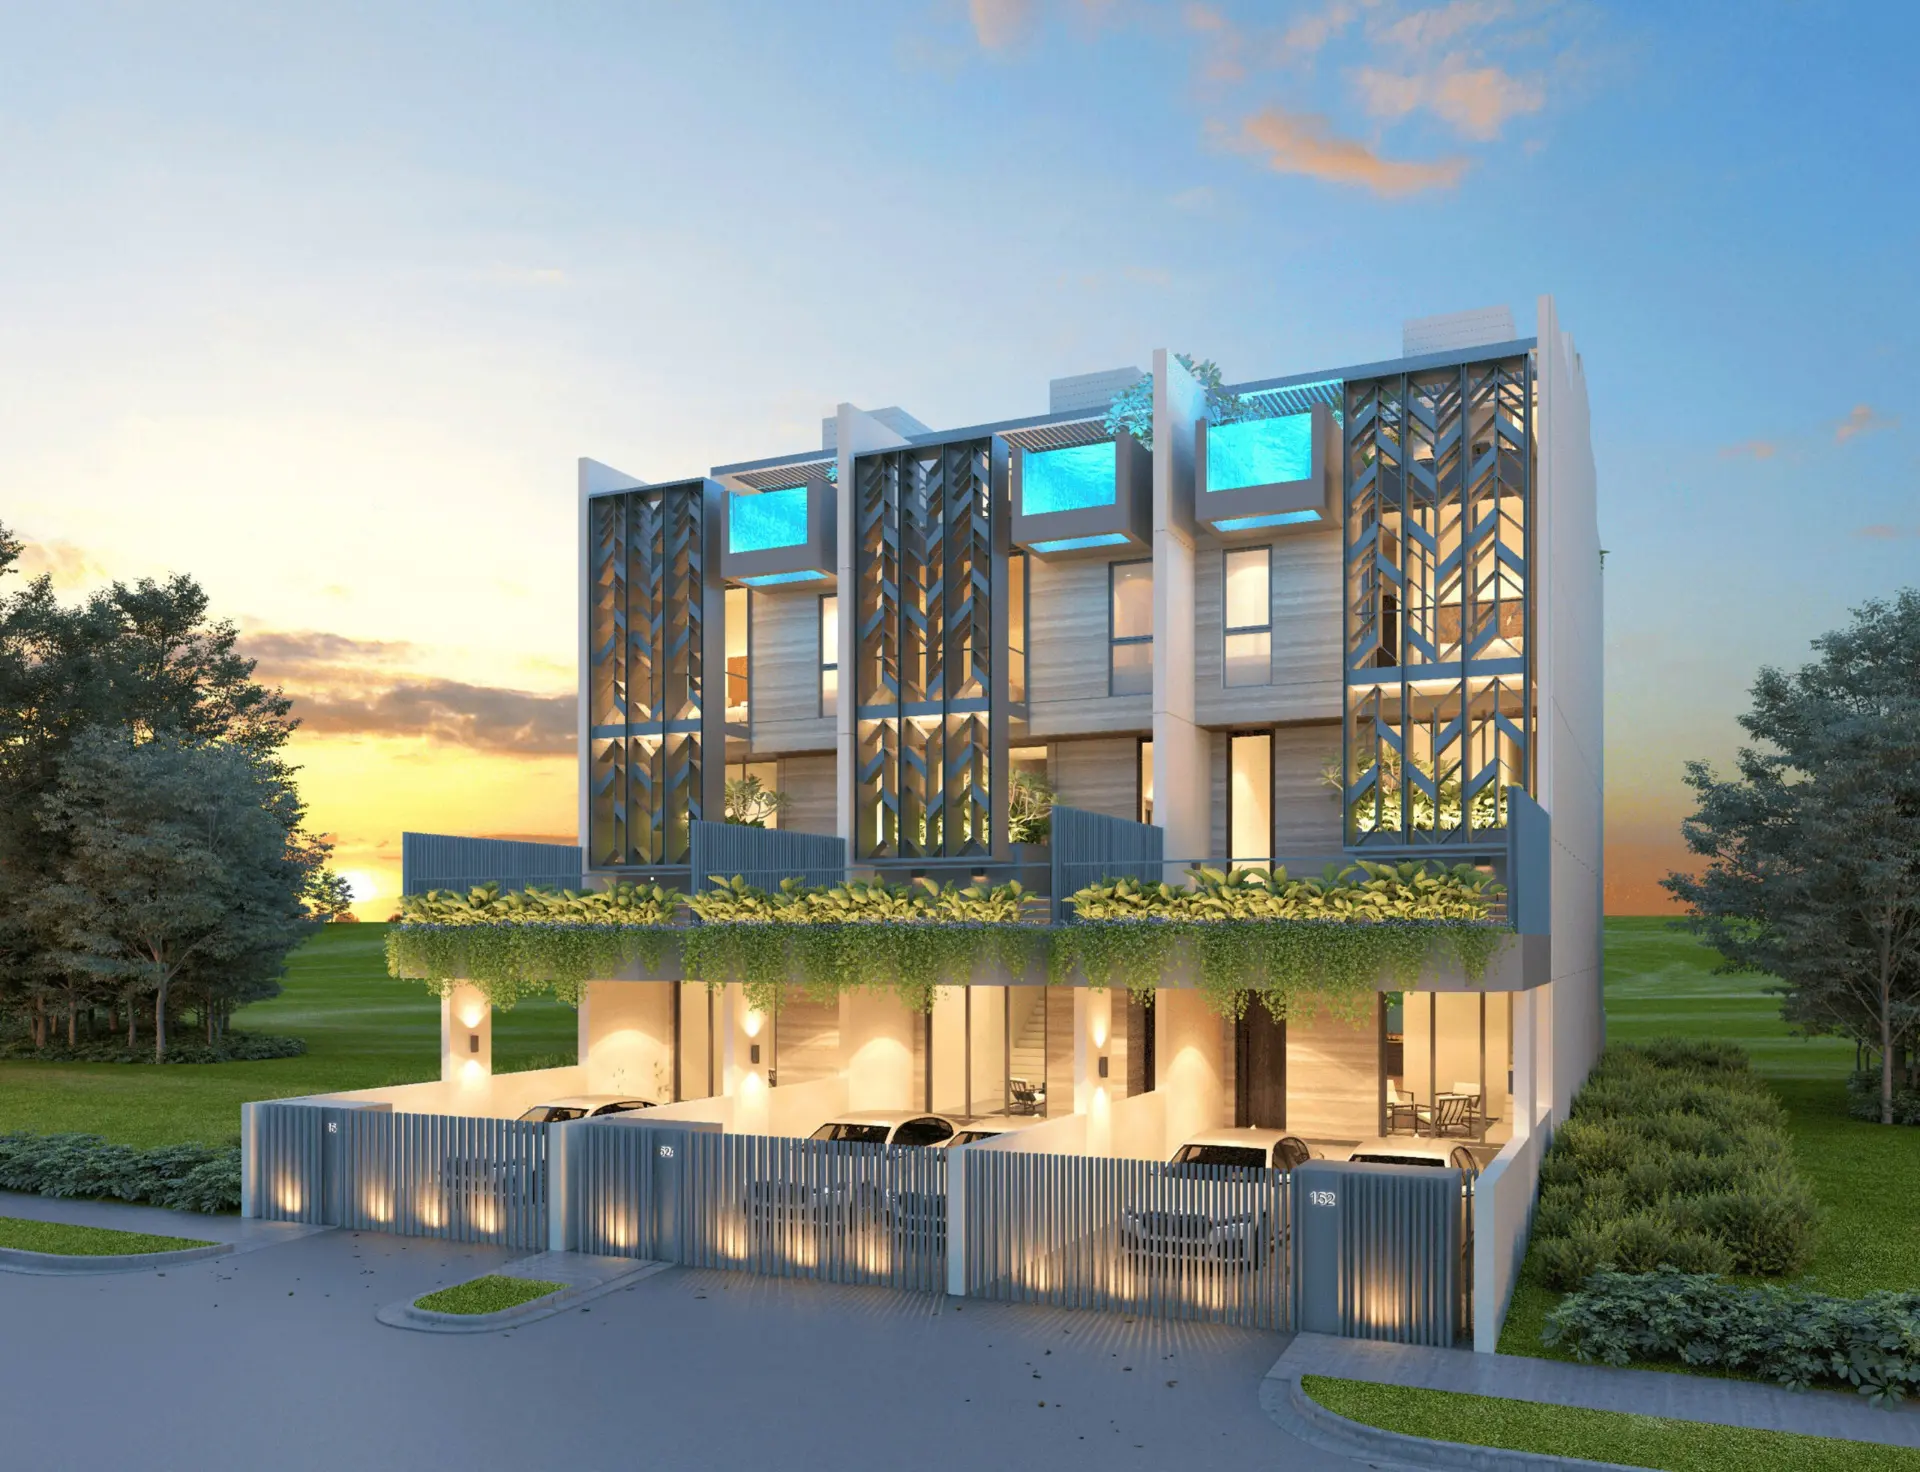
5 Bed · 5 Bath · 3-storey intermediate terrace · Freehold · Land 1,744 sqft · Built-up 5,140 sqft
S$7.5m
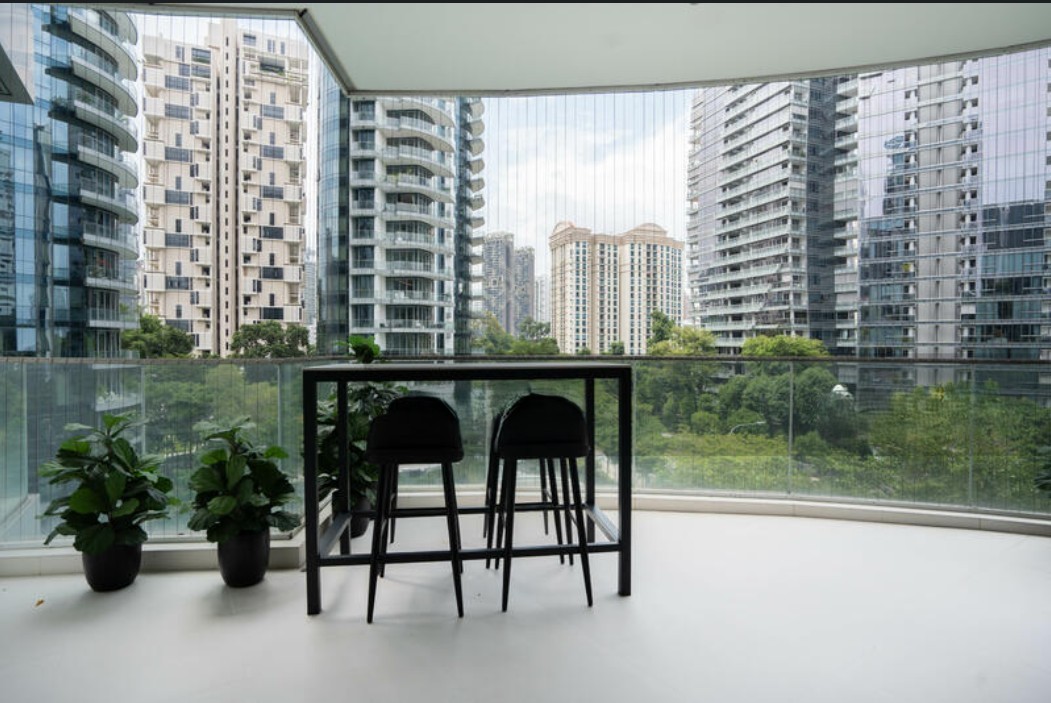
4 Bedroom · 2,840 sqft · District 10
From S$9m
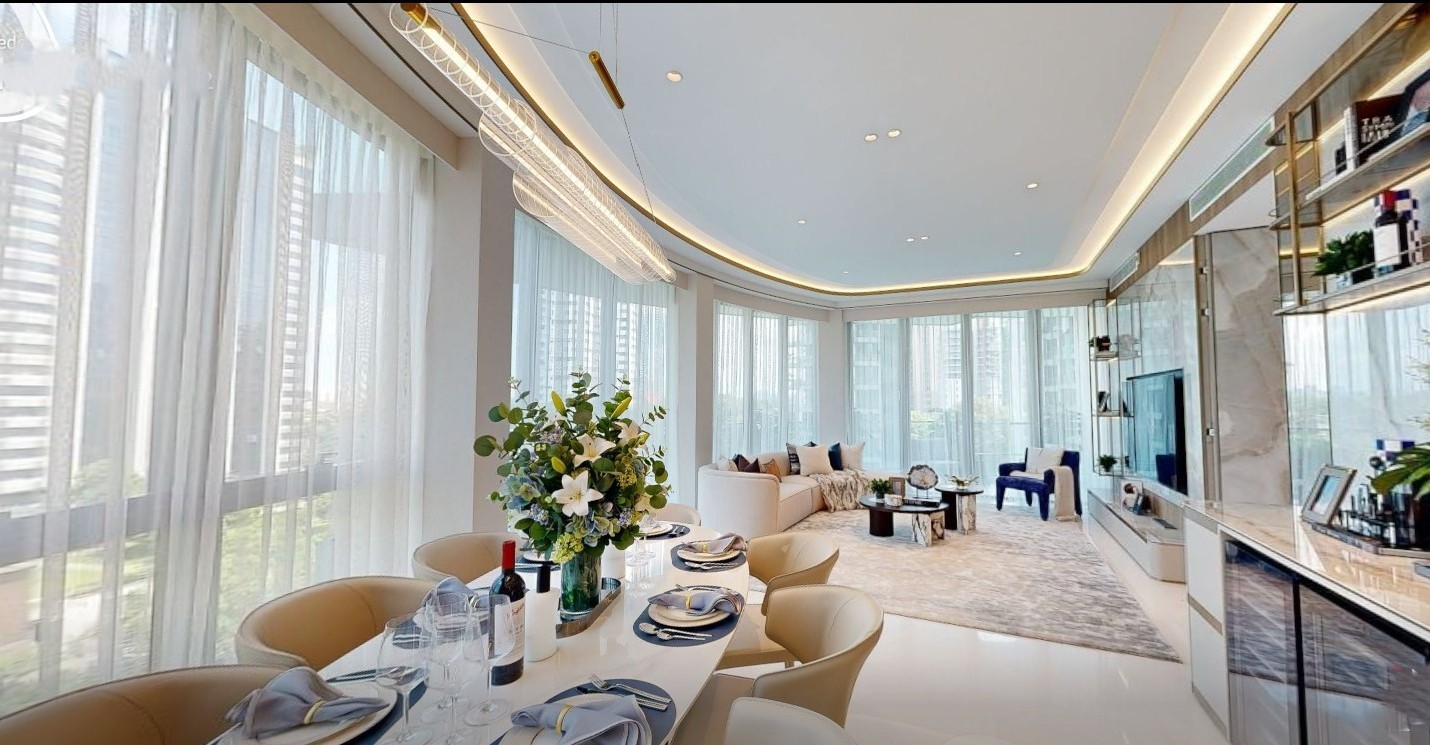
3 Bedroom · 2,153 sqft · S$2,153 psf · District 10
From S$7m
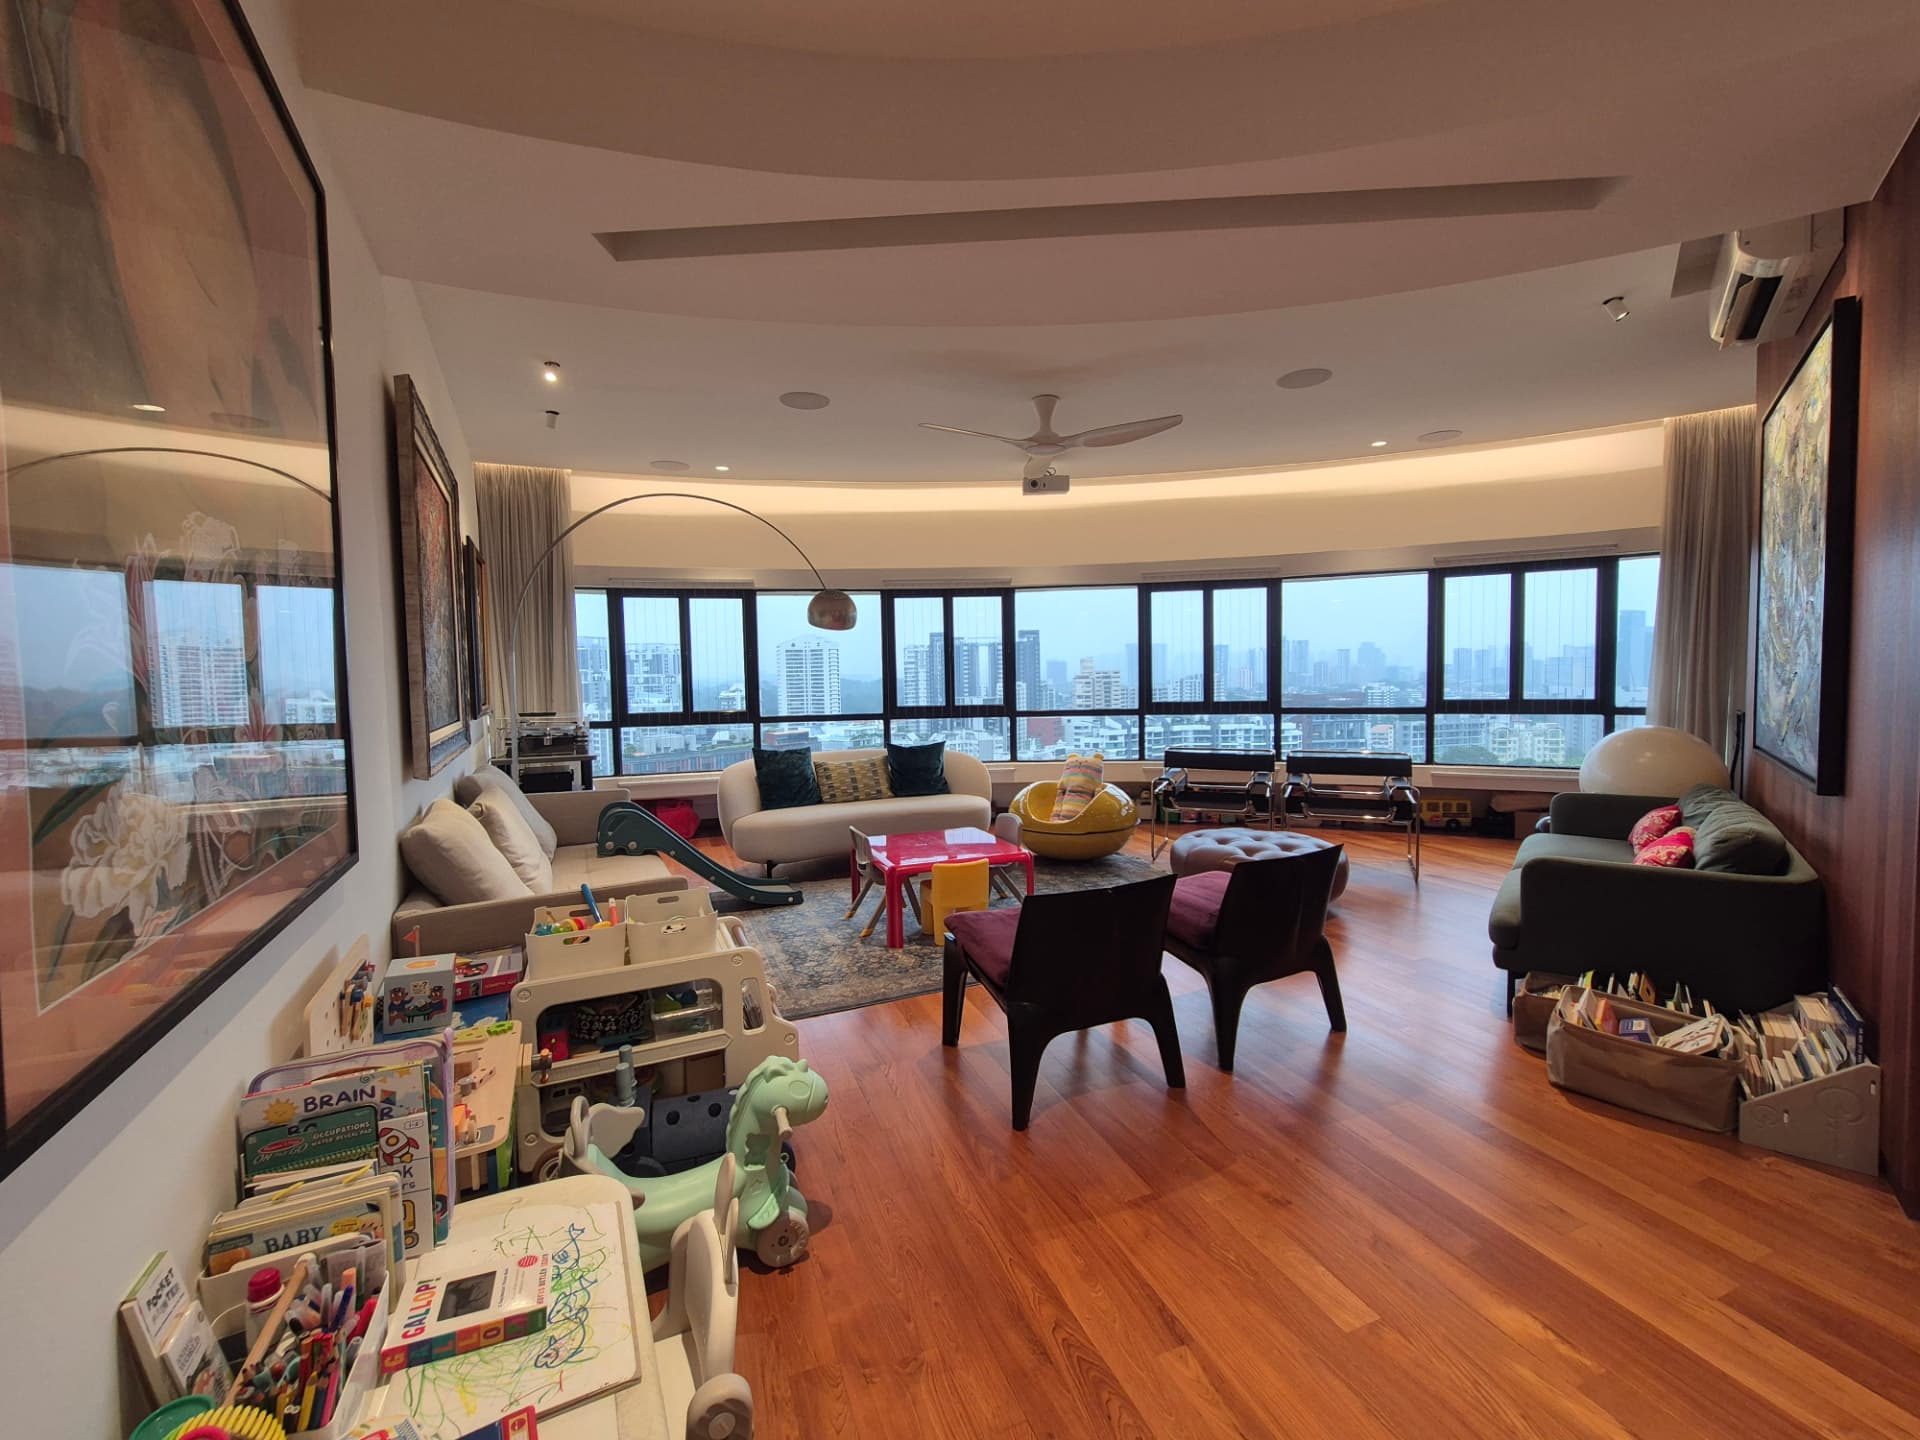
4 Bedroom · 2,650 sqft · District 10
From S$7.5m
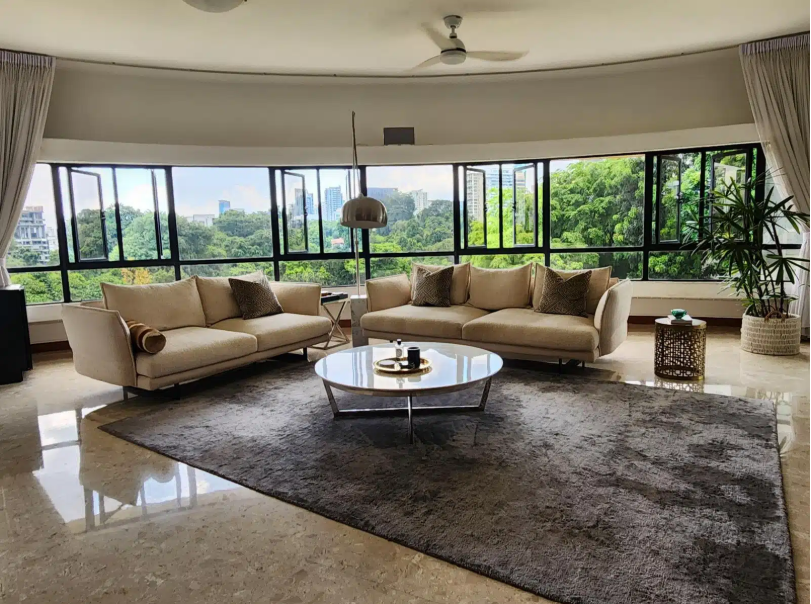
4 Bedroom · 2,650 sqft · District 10
From S$6.5m
New launches · selling out
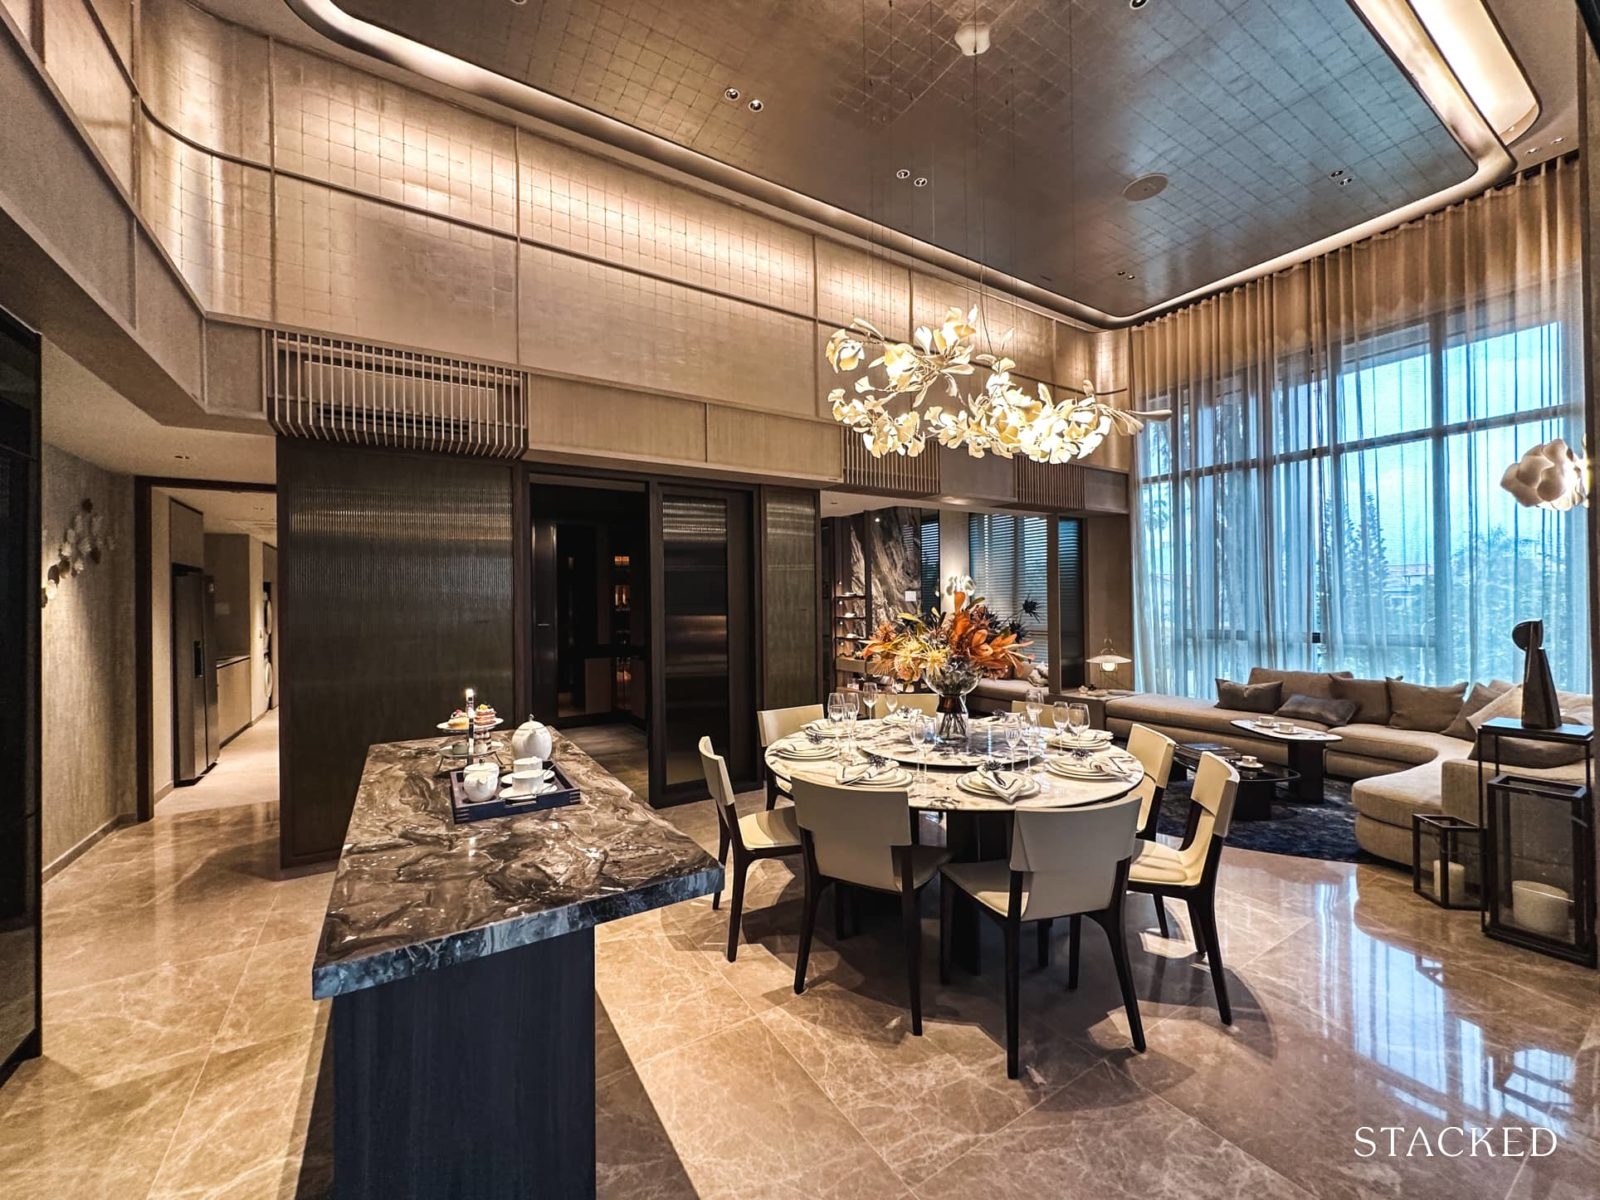
4 & 5 Bedroom · Tanjong Katong · Freehold
From S$2,800 psf
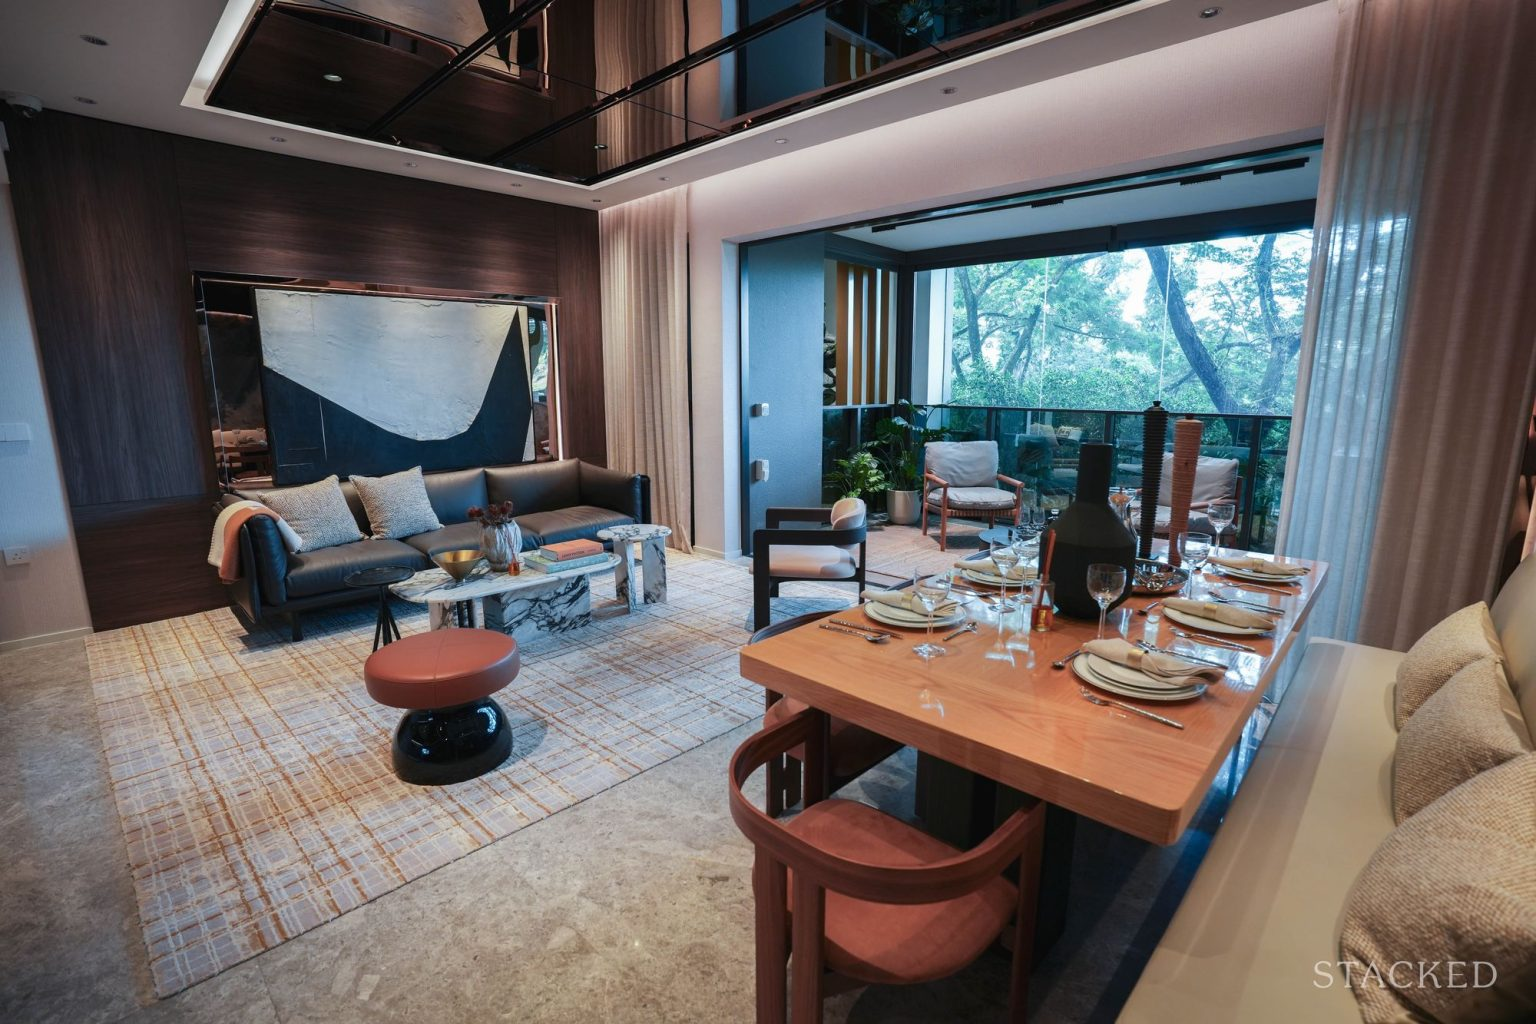
4 & 5 Bedroom · East Coast · Freehold
From S$3,000 psf
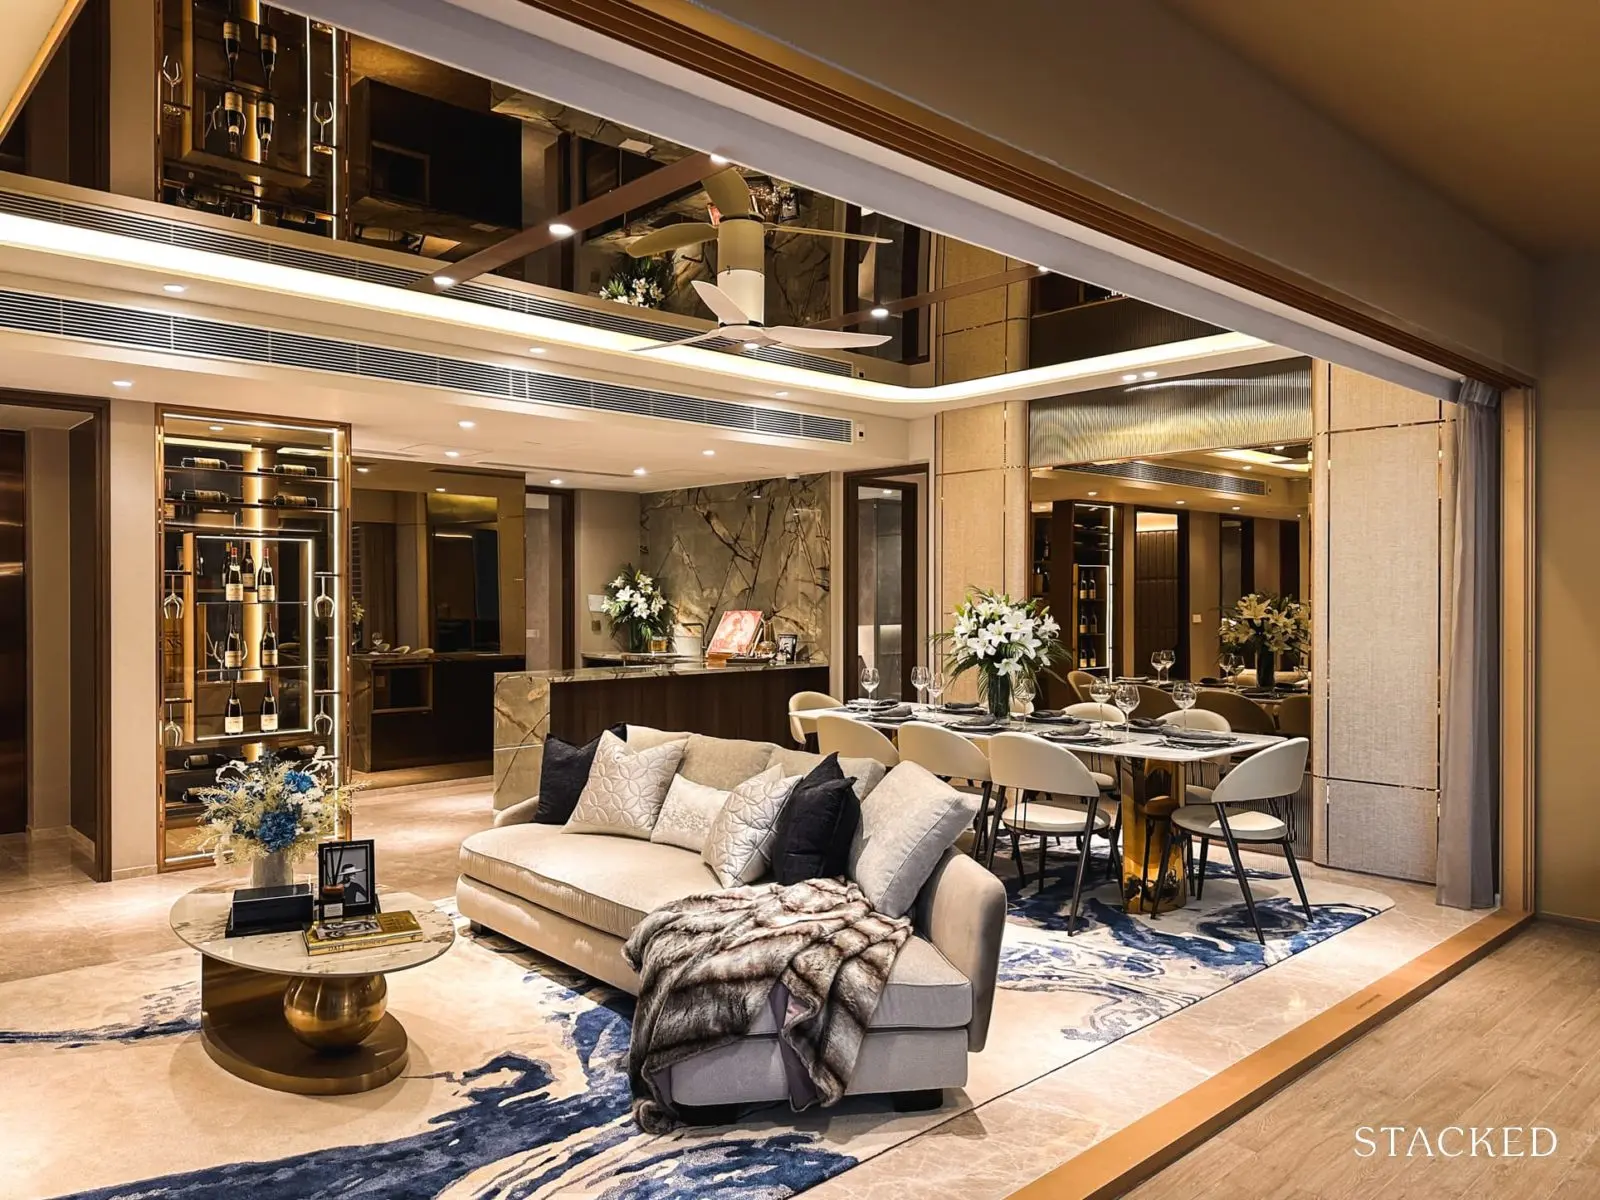
1 Bedroom + Study & 5 Bedroom · Dakota · 99-yr
From S$2,800 psf
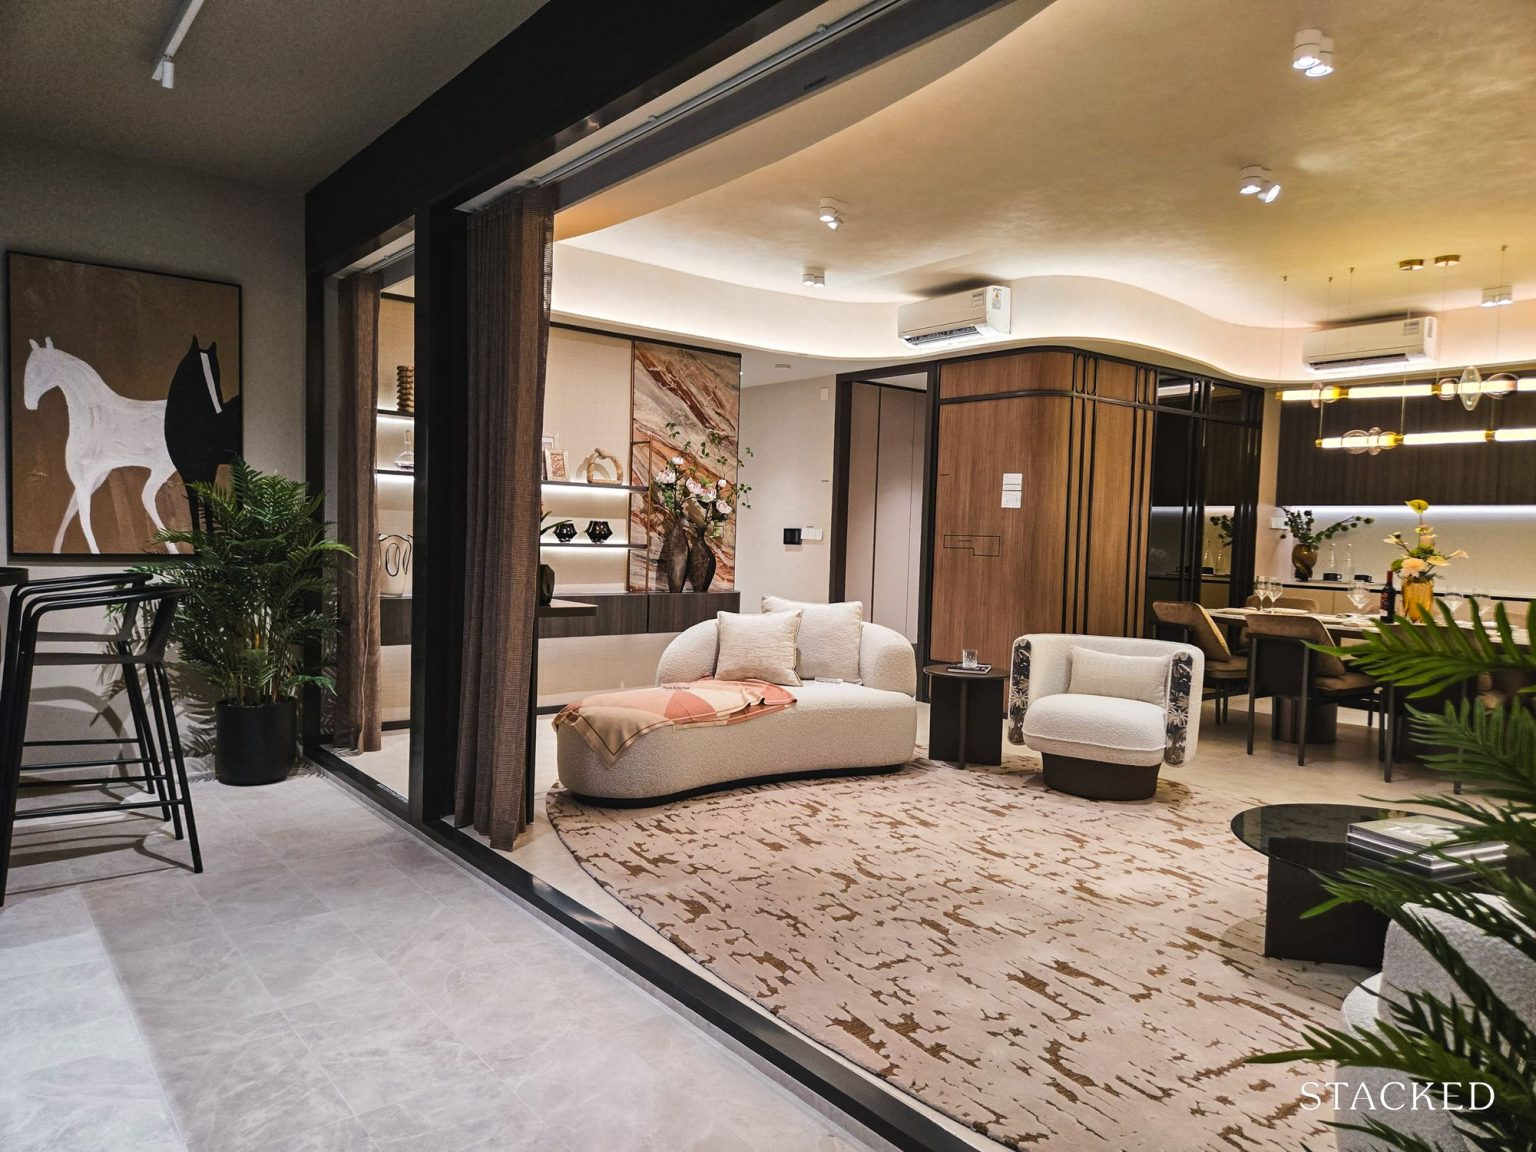
One North · 99-yr
From S$2,500 psf
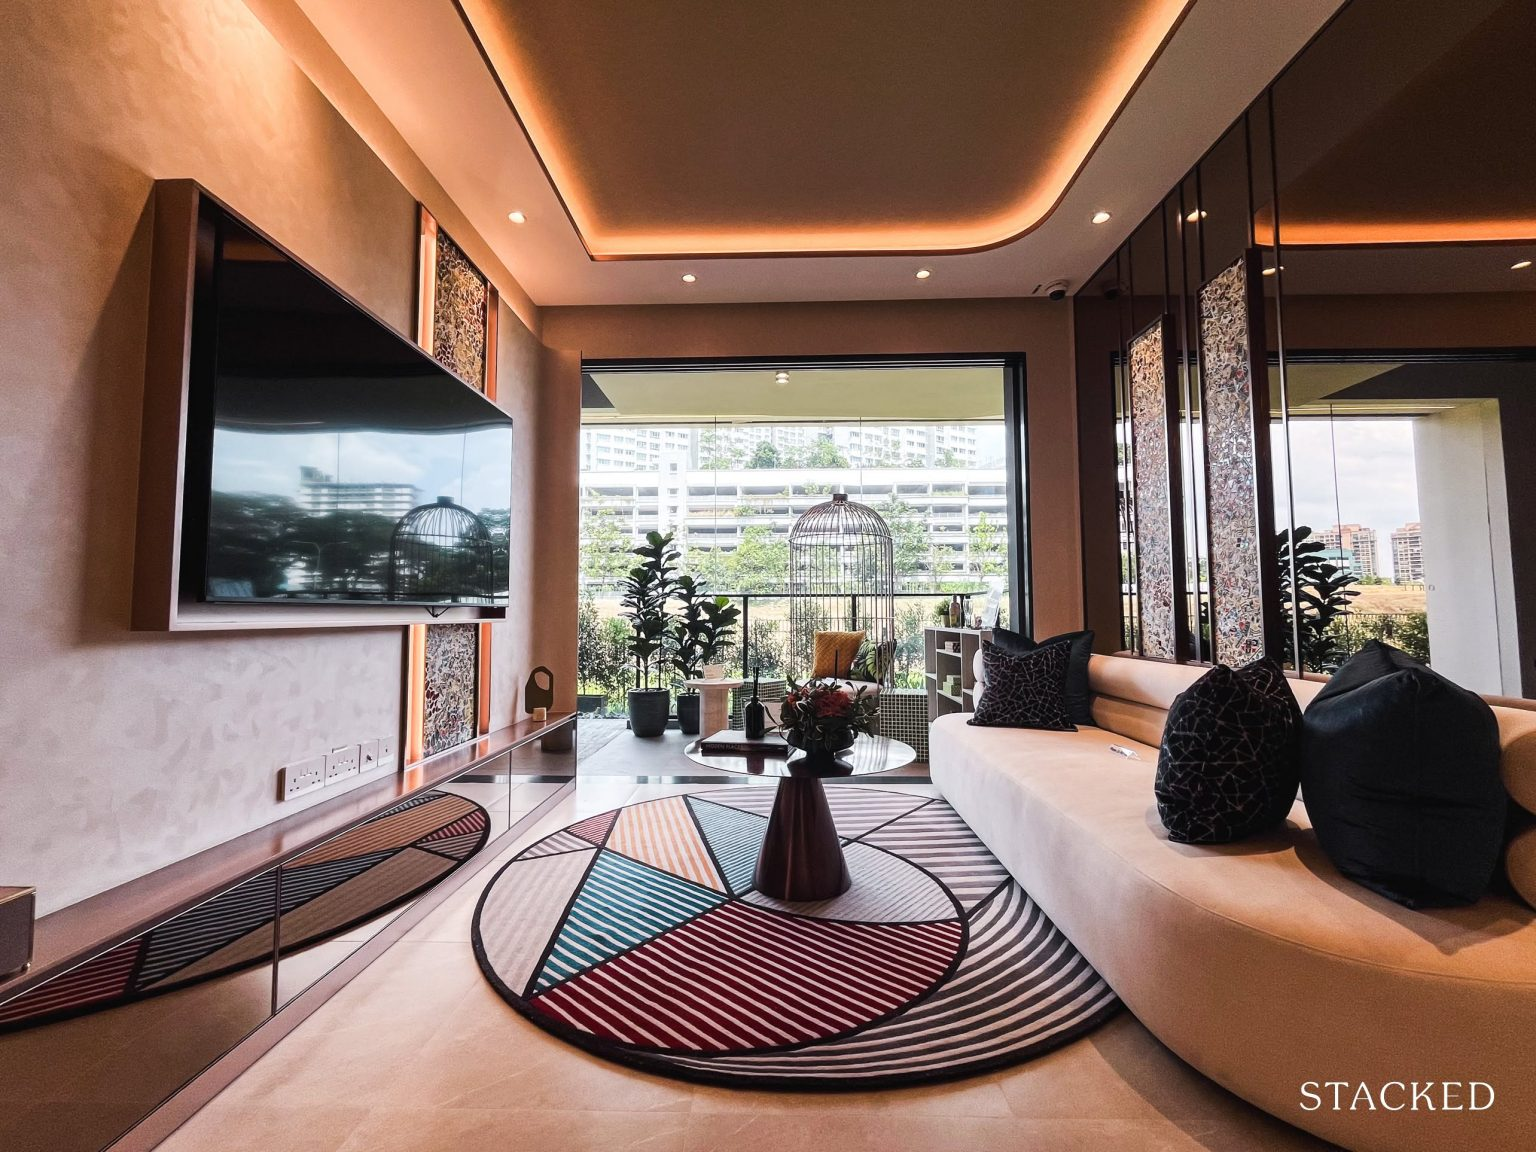
1 Bedroom + Study & 3 Bedroom Dual Key · Toa Payoh · 99-yr
From S$2,800 psf
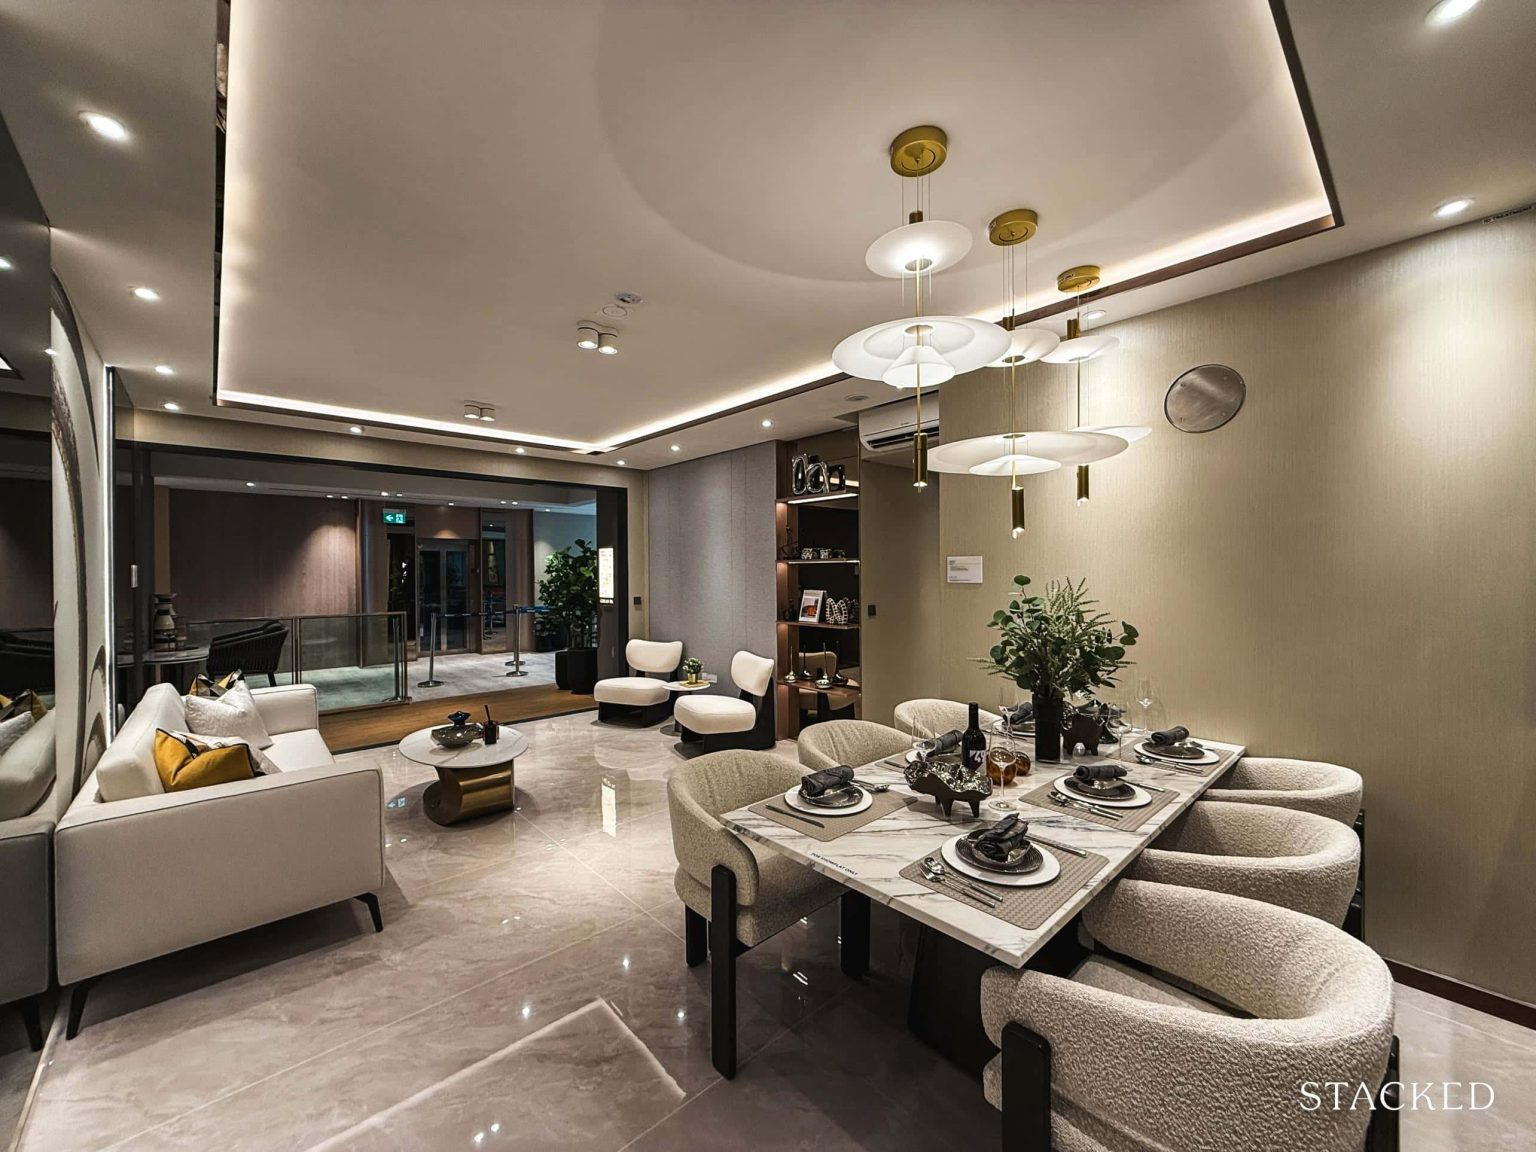
2 & 3 Bedroom · Lorong Chuan · 99-yr
From S$2,600 psf
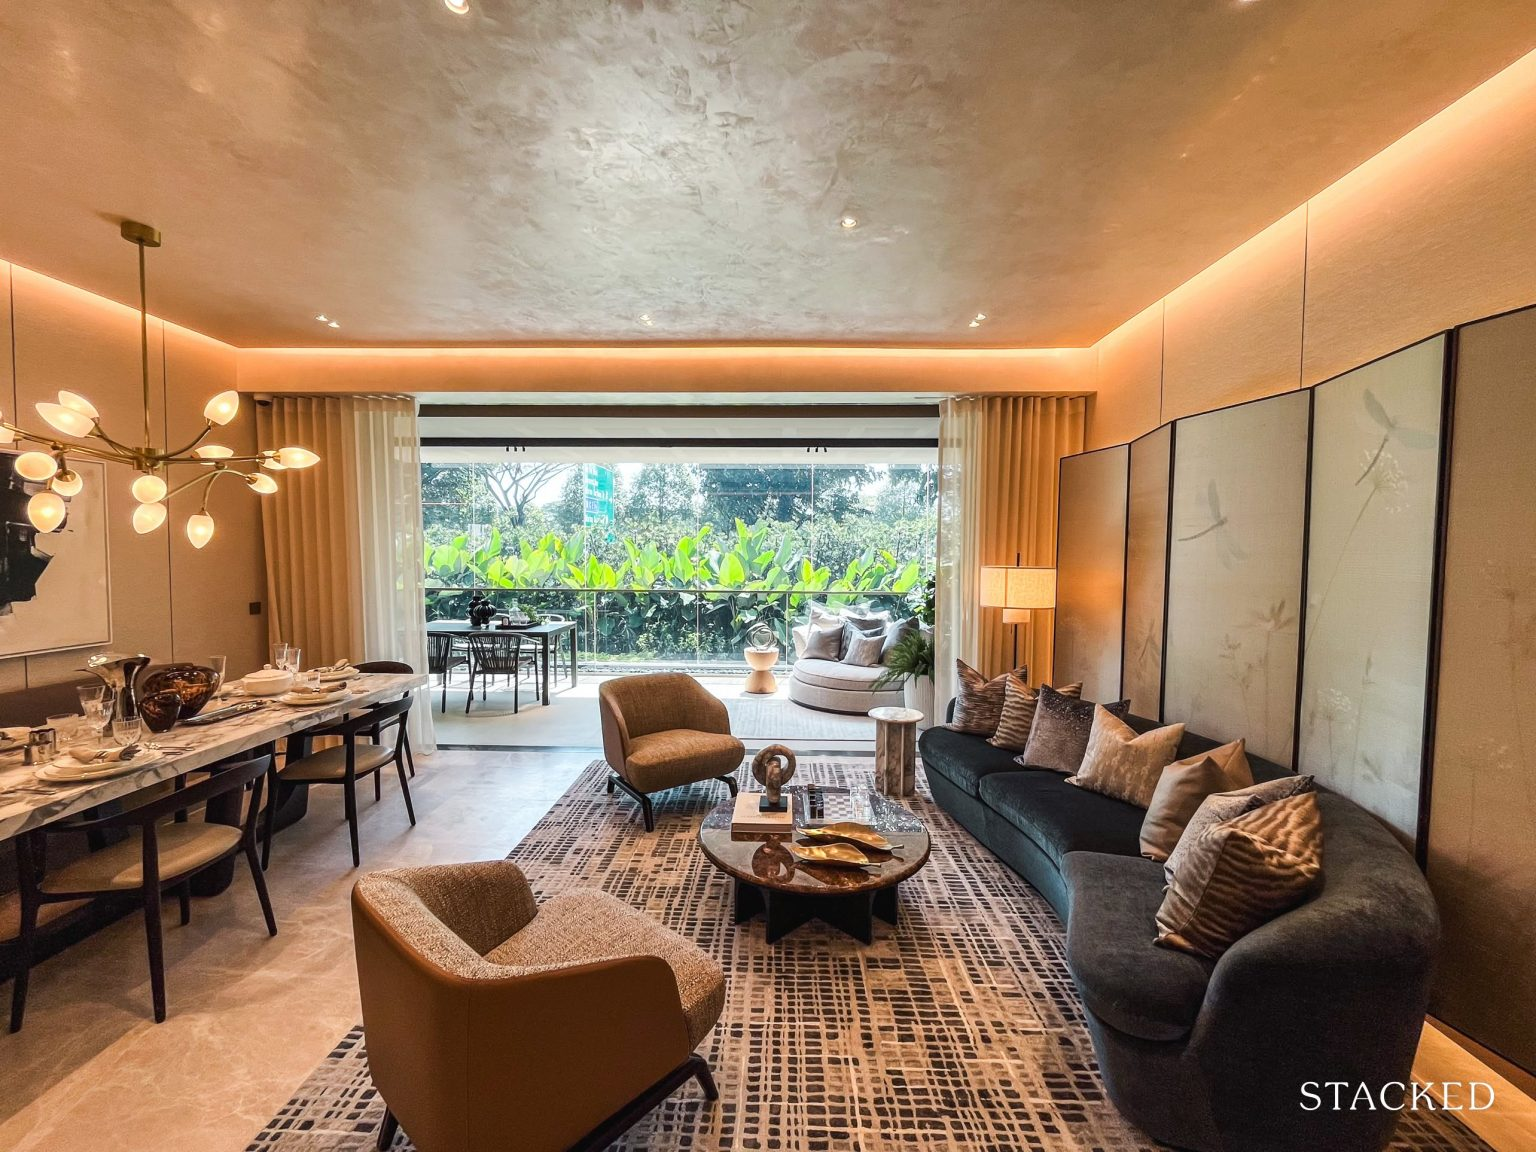
Beach Road · 99-yr
From S$2,800 psf
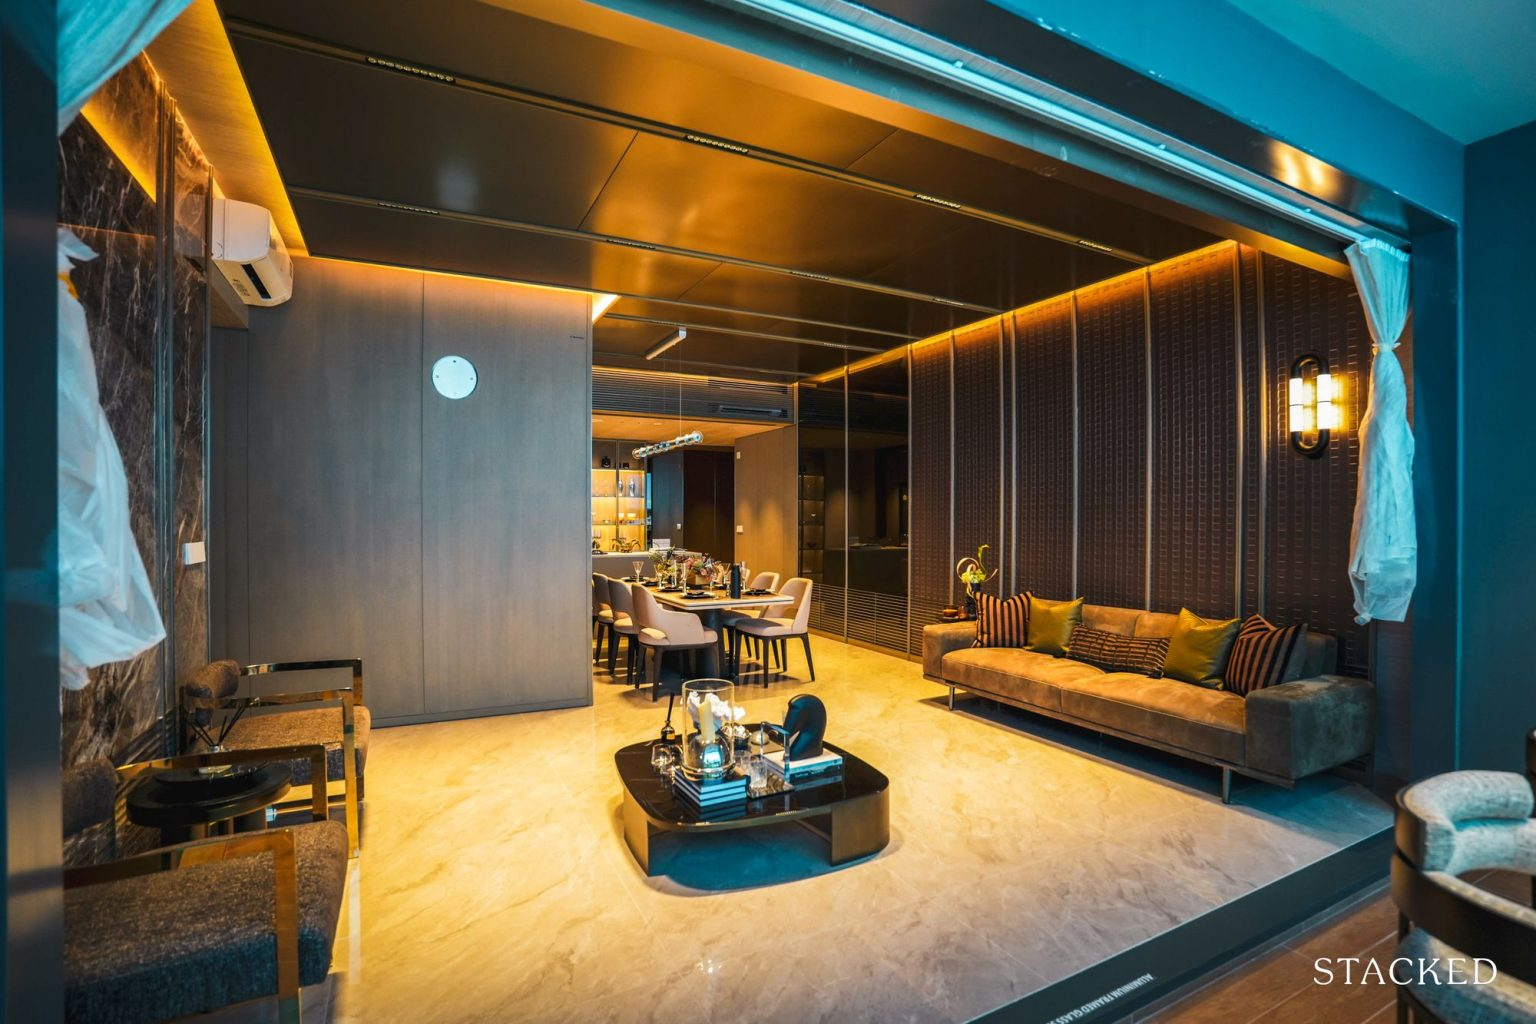
Lentor · 99-yr
From S$2,400 psf
Three questions the market keeps asking
Developers release in phases and price each phase off absorption rate, not off valuation. Early buyers are effectively buying the lowest price the project will ever print — and the sell-out signals a supply gap in that submarket, not hype.
Median launch-month take-up in 2024–25 tranches: 60–85%
Next step
Send me your project and unit type. You will get the transaction ladder for your stack, an honest price band, and a straight answer on whether now is the window — before any talk of appointing me.